Although we may feel that the wealthy seem to own an abnormally large share of the nation’s resources, actually viewing current data on income concentration can have a profound impact. For me, it has both strengthened a commitment to my ongoing personal work in the community, and driven me to advocate for stronger policy-level adjustments as well.
Take a close look at the long-term trends in income distribution. As shown in this chart, the top 1% of earners in the United States garnered about 20% of the nation’s income in 2010.
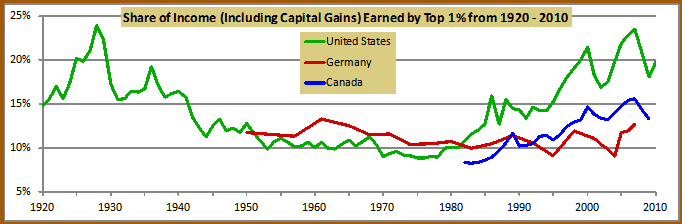
This chart was generated using data downloaded on 11-Oct-2012 from the The World Top Incomes Database using the following parameters: Countries: Canada, Germany, United States; Years: 1920-2010; Variable: “Top 1% Income Share-including Capital Gains”
This reflects a dramatic, two-decade increase, to levels unseen since the Great Depression. While I am no fan of “Robinhood” policies that attempt to transfer wealth from the “haves” to the “have-nots”, I am troubled to see data which seem to indicate that the accumulated policies of the last generation may have accomplished exactly the opposite.
A study published in March, 2012 by the Congressional Research Service, an arm of the Library of Congress, titled The U.S. Income Distribution and Mobility: Trends and International Comparisons, provides a starkly clear picture. Although this 18-page report filled with dense economic jargon is tough reading, three of its conclusions are very revealing:
From the opening summary: Based on the limited data that are comparable across nations, the U.S. income distribution appears to be among the most uneven of all major industrialized countries and the United States appears to be among the nations experiencing the greatest increases in measures of inequality.
From page 15: This pattern suggests that the opportunity for children in the United States to attain incomes that exceed their parents’ relative incomes was lower after 1980 compared to the preceding four decades.
From the concluding remarks: It also appears that going from rags to riches is relatively rare; that is, where one starts in the income distribution greatly influences where one ends up. Whether due to skill-biased technological change, globalization or other factors, it commonly is thought that the dampened income prospects of low- and middle-skill workers and their children relative to those in high-skilled households are a cause for concern.
Whoa! Did you feel that virtual slap-across-the-face like I did? America is the land of opportunity, right? We believe that everyone in America has an equal chance for prosperity and success through hard work, yet we hear, “where one starts in the income distribution greatly influences where one ends up.” What are these data saying about the essence of the American Dream? Can it be true?
Unfortunately, it might be. A Gallup poll conducted in April, 2011 titled In U.S., Optimism About Future for Youth Reaches All-Time Low concludes, Confidence in the traditional American dream — that each generation can work its way up in the world and have a better life than the previous generation — appears to be slipping away. Americans are less likely to believe this to be true today than at any time on record, including during the worst of the recent economic crisis.
A Pew Research Center report released in August, 2012 titled The Lost Decade of the Middle Class opens with the statement, America’s middle class … has endured a lost decade for economic well-being. Since 2000, the middle class has shrunk in size, fallen backward in income and wealth, and shed some—but by no means all—of its characteristic faith in the future.
As might be expected, with income concentrated for the past two decades among the top 20% of earners, they now possess a greater share of the nation’s wealth. In the chart below, Net Worth is the total of all privately held assets, such as stocks, bonds, and real estate, less debts, such as mortgages and credit cards.
This chart was generated using data downloaded on 12-Oct-2012 from Table 1 in the article Wealth, Income & Power by G.william Domhoff
The top 20% are slowly accumulating more and more. The share of private wealth owned by the bottom 80% has dropped from 18.7% in 1983 to 11.1% in 2010. Put another way, the wealthiest 20% of Americans increased their control from just over 80% to almost 90%. With this wealth comes power and influence, as we see so graphically on televisions and in mailboxes that are bombarded by hundreds of millions of dollars worth of of campaign advertising, which we know is not paid for by folks at the bottom of the economic ladder.
These data give me further inspiration – maybe even driven by a sense of guilt – to do more in our community. Susi and I are passionate about Habitat for Humanity (please see our Columbus Global Village Team web site) because we believe it is one of the most effective ways to marshal donations, leverage them with volunteerism, and directly impact families with a newfound sense of freedom and hope for a better future. We have long donated to and volunteered with the United Way of Central Ohio because it effectively builds a community in which everyone has the aspirations, resources, and opportunities to reach their fullest potential. Although our part is miniscule, we know we must do what we can – and even more so in the face of these dramatic income and wealth statistics.
Studies cite many factors such as globalization, new technology, education and training initiatives, tax policies, welfare programs, declining labor union representation, and aging population demographics in a futile attempt to assign cause and effect. We live in a massively complex system, continually barraged by forces ranging from the local affairs rippling through our neighborhoods to international crises hitting like tidal waves. We struggle to comprehend the breadth and magnitude of the issues, let alone think we have any control, or any ability to impact the outcomes.
However, we do have a choice this election season, and I’m hoping that some hard data can displace a bit of the hyperbole and emotional negativity of campaign rhetoric. While I do not believe that there is any evidence for a “right” level of income equality, these trends speak volumes. In the United States, wealthy people take in a greater share of total income than in any other industrialized country; they earn more now than they have at any time in almost a century; their growing control of total wealth is unprecedented; and pollsters report flagging belief in the American Dream of opportunity for all. This stark picture convinces me of the need for a “midcourse correction”, forcing me to examine which policies seem more likely to foster a greater equality of opportunity for all Americans.
Our country – and the entire world – continues a slow recovery from what Harvard economist Kenneth Rogoff calls The Second Great Contraction that was caused by universal over-dependence on debt during the past two decades. Barack Obama and Mitt Romney, while agreeing that faster economic growth is the top priority, offer markedly different approaches: Romney wants to unleash businesses by reducing regulations and taxes; Obama wants to stimulate growth through job programs and tax cuts aimed directly at the middle class.
Although Romney’s proposal to cut taxes across-the-board and close loopholes as the path to prosperity might possibly work, what concerns me is the likelihood of a compounding effect on income concentration. A 20% reduction in tax rates has much greater effect on higher incomes. Here are some comparisons based on 2009 data from the Congressional Budget Office:
| Income Group | Average Income per Household | Average Taxes Paid per Household | Savings per Household from a 20% Tax Cut |
| Middle 20% | $64,300 | $7,200 | $1,140 |
| Top 20% | $223,500 | $51,900 | $10,380 |
| Top 1% | $866,700 | $353,000 | $70,600 |
The initial effect we see from this tax policy is ten times more savings for high-income households than for families in the middle class – or even seventy times greater for the Top 1%. Granted, Romney promises to close loopholes and limit deductions to make his program revenue neutral, and many of his unspecified changes will also have a larger impact on the top earners. But, can we really afford to take a chance on a plan that starts with another large increase in the concentration of after-tax income into the hands of the wealthiest among us? Personally, I am skeptical that the politicians will enact sufficient reforms to offset these huge tax savings for those with the highest income.
Although my preferences on social issues tend toward the Democrats, my fiscal conservatism usually trumps them, and Republican candidates garnered most of my votes through 2000. Then, during the last decade, abhorrence of war pushed me to support many Democrats. Now, with most of our troops finally heading home, I had thought that the relatively higher importance on tax and spending policies would return me to the Republican fold. However, after looking at these data, I’m afraid it is not going to happen this year.
For me, the bottom line is a feeling that we must return a sense of hope and a renewed belief in the American Dream to the vast majority of our population. Although I am fortunate to find myself in the upper half of the income range, and thus would probably get more personal benefit from Romney’s program, I feel compelled to support Obama because his policies will more directly and unequivocally address the needs of the middle class.
Please see the Bloomberg November, 2012 editorial “Why Income Inequality Went Missing in the 2012 Campaign” available at https://www.bloomberg.com/news/2012-11-04/why-income-inequality-went-missing-in-the-2012-campaign.html?alcmpid=view. They argue that “with the opportunity gap growing, the tax code certainly shouldn’t encourage more inequality, as it now does”, and provide several concrete suggestions regarding estate taxes, tax deductions, and education savings accounts.
For further research on trends in inequality please see the April, 2011 paper “Inequality and the Deficit” by Stephen B. Cohen of the Georgetown University Law center available free of charge at https://scholarship.law.georgetown.edu/fwps_papers/147 or at https://ssrn.com/abstract=1890645. The author explains several trends in inequality measurement, and calls upon President Obama to clearly “explain the enormous increase in income inequality since 1968 and the relevance to allocating the pain of deficit reduction”.
Thanks, Dave. These are the things that bother me, too. While I am by no means rich, however, my income, including pension and distributions from savings, places me with the privileged class. I think that to get our country’s fiscal house in order, we will all need to pay more in taxes.
You didn’t mention military spending. The fact that the U. S. spends more on defense than something like the next 15 countries combined is outrageous. But my conservative friends say that we should spend even more because we have so many enemies around the world. What Obama has proposed does not “gut” the military. His proposal continues to spend heavily on defense.
Too much of our economy depends on defense spending. I sometimes wonder if defense and the “war on drugs” aren’t government welfare programs to employ lots of people.